MCDA Tool.
From a spreadsheet process to a tool people can explore.
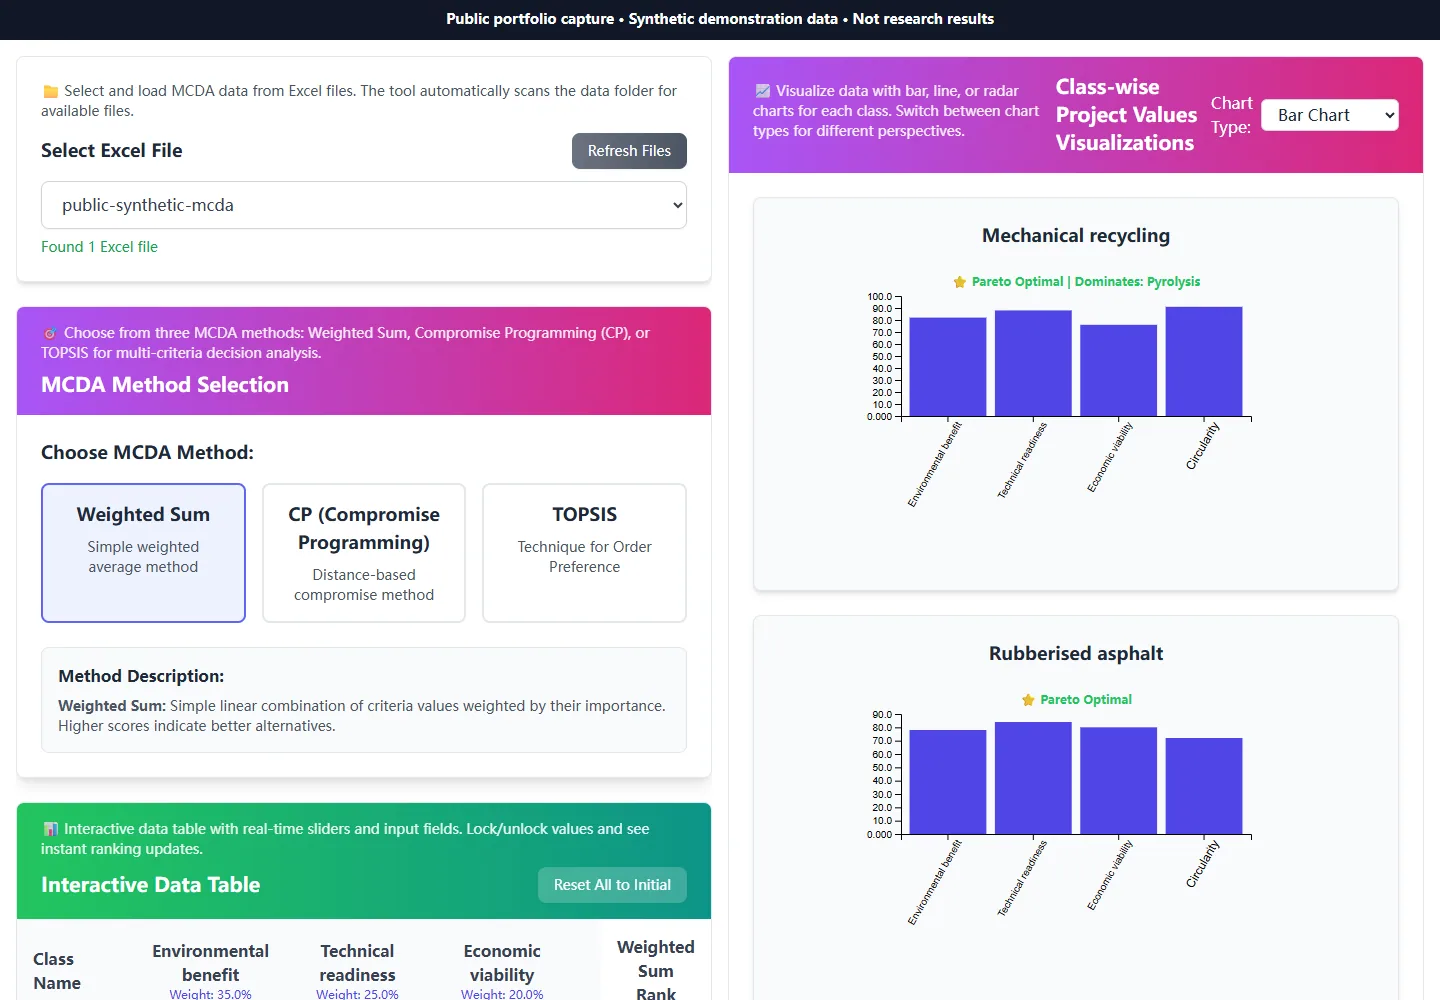
MCDA interface showing synthetic alternatives, rankings and charts.
- 01
Problem
How do you compare recovery options when environmental, technical and economic priorities compete?
- 02
Context & constraints
The existing process lived in Excel. Researchers needed to change criteria and weights themselves, and every ranking had to stay explainable rather than a black-box score.
- 03
My contribution
I developed the interactive analysis tool during The End of Tire research project at MaREI, translating an Excel-based analysis process into a web interface.
- 04
Approach & implementation
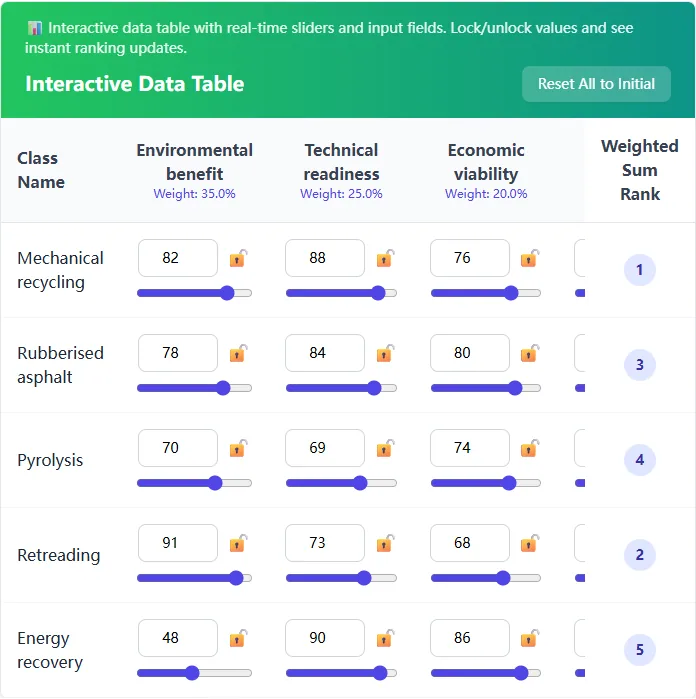
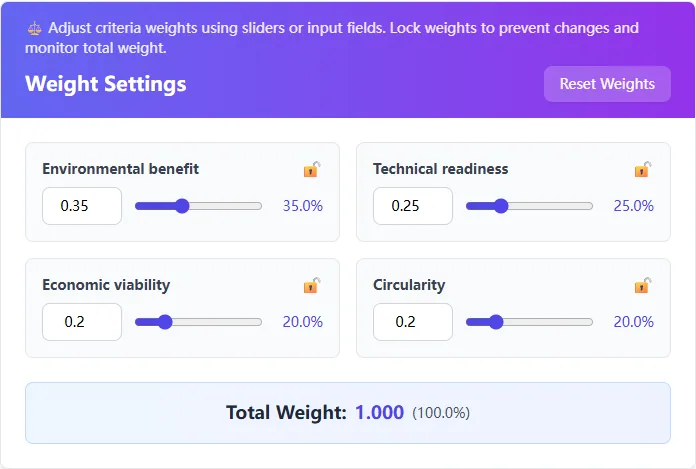
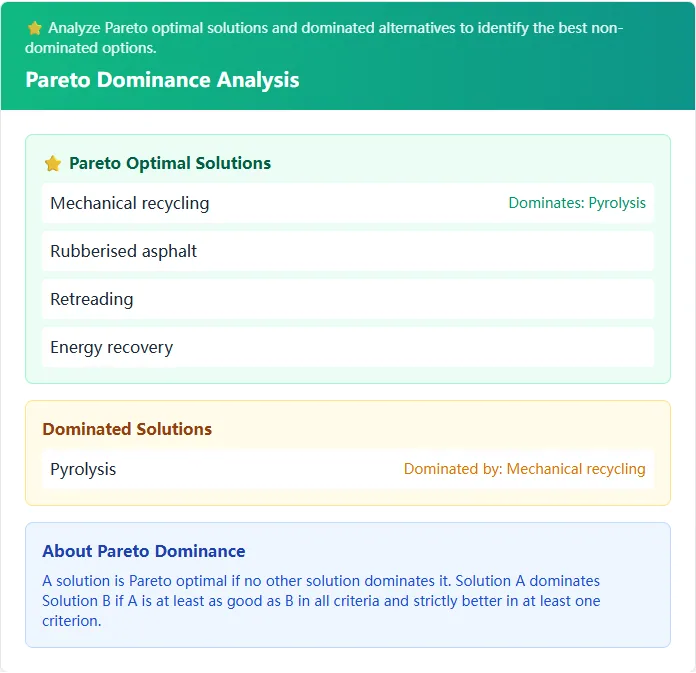
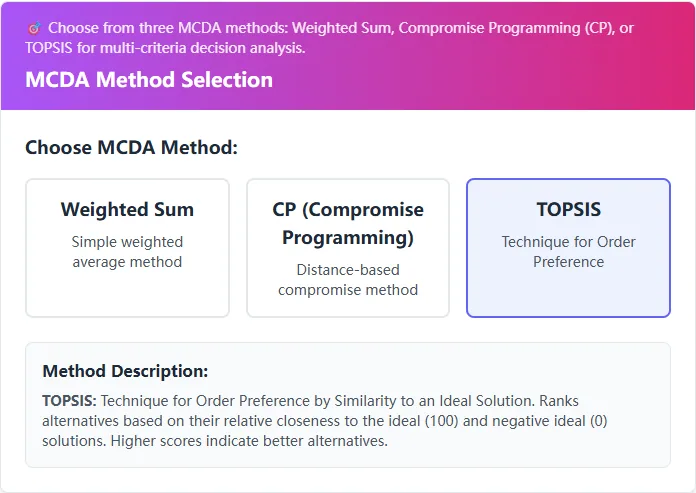
Structured Excel inputs feed adjustable criteria and weights, value locking, and weighted-sum, TOPSIS and Pareto views. Rankings update as assumptions change, so the reasoning can be inspected.
- Excel input workflow
- Adjustable decision weights
- Weighted-sum, TOPSIS & Pareto
- 05
Outcomes & evidence
The completed tool exposes editable inputs and live rankings in a web interface. The public source and synthetic-data screenshots demonstrate the analysis workflow; commercial adoption and time savings have not been measured.
- 06
Limitations
Rankings depend on input quality, chosen criteria and weights. Public screenshots use synthetic alternatives; they do not establish an optimal real-world recovery decision or independently validate the research.
- 07
Future work
Extend the case study with documented validation and additional sensitivity scenarios.
Interface walkthrough
Stack
JavaScript · D3.js · Excel · Node.js
Evidence & source
README.txt documents Excel input, value locking and weighted ranking; app.js contains TOPSIS and Pareto implementations. Screenshots below show synthetic examples.
Read project documentation ↗